🏀 Sports Betting Strategy Analysis: Red Sox vs. Yankees
MAIN TOOL
Excel Workbook
Secondary tool
Statistics and Probability
INDUSTRY
Sports
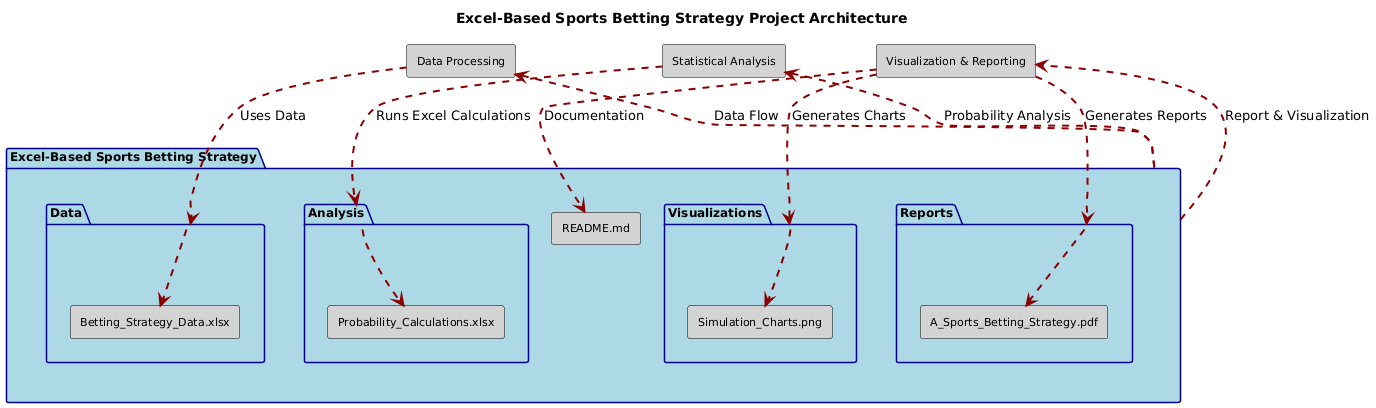
📚 About the Project
This project analyzes betting strategies in a best-of-three and best-of-five series between the Boston Red Sox and the New York Yankees. The analysis evaluates the probability of winning the series, expected net wins, and the effectiveness of different betting strategies. Statistical methods and simulations are used to draw meaningful insights into the profitability and risks of the betting strategy.
🔍 Key Objectives
Evaluate Probabilities:
Use theoretical probabilities to calculate series outcomes for the Red Sox.
Construct Net Win Distributions:
Calculate expected net win, variance, and standard deviation for various scenarios.
Simulations:
Run 10,000 simulations to model the risk and validate theoretical results.
Goodness-of-Fit Tests:
Use chi-squared tests to determine how well observed results align with theoretical distributions.
Summarize Insights:
Compare strategies to assess which is most favorable and under what conditions.
🚀 Tools & Techniques
Data Analysis: Microsoft Excel for calculations, simulations, and visualization.
Statistical Methods: Probability distributions, confidence intervals, chi-squared tests.
Simulations: Monte Carlo methods using Excel’s RAND() function.
📊 Key Results
Best-of-Three Series
Probability of Red Sox Winning: 56.64%
Expected Net Win: $57.89
Risk: High standard deviation of $795.15 reflects substantial variability in outcomes.
Simulation Results: Confidence interval [44.25, 75.59] includes the expected value.
Best-of-Five Series
Probability of Red Sox Winning: 56.09%
Expected Net Win: $76.35
Risk: Even higher standard deviation of $1024.73 highlights significant variability.
Simulation Results: Confidence interval [39.98, 80.43] aligns with theoretical expectations.